
In the modern economy, where recurring revenue and lifelong customer relationships often matter more than one-time sales, “customer success” has evolved from a support function to a strategic imperative. Organizations no longer ask whether customer success should exist—but how it should operate, measure impact, and guide decision-making. At the heart of this effort lies a powerful, often overlooked framework: the customer success Venn diagram.
Simple in form yet profound in implication, a Venn diagram offers more than a visual. It captures the convergence of three critical domains—customer goals, product capabilities, and company outcomes. This article explores how a Venn diagram model can reframe customer success strategy, clarify cross-functional alignment, and ensure value delivery at every touchpoint.
Understanding Customer Success as Strategy
Before unpacking the diagram, it’s essential to define what customer success means today. At its core, customer success is about ensuring that customers achieve their desired outcomes while using your product or service. It shifts the business relationship from transactional to transformational.
It involves:
- Anticipating customer needs
- Enabling product adoption
- Driving satisfaction and renewals
- Identifying opportunities for expansion
This is a team sport. Sales, product, marketing, and support all contribute. Yet without a clear model to navigate these roles, efforts often become fragmented. Enter the Venn diagram.
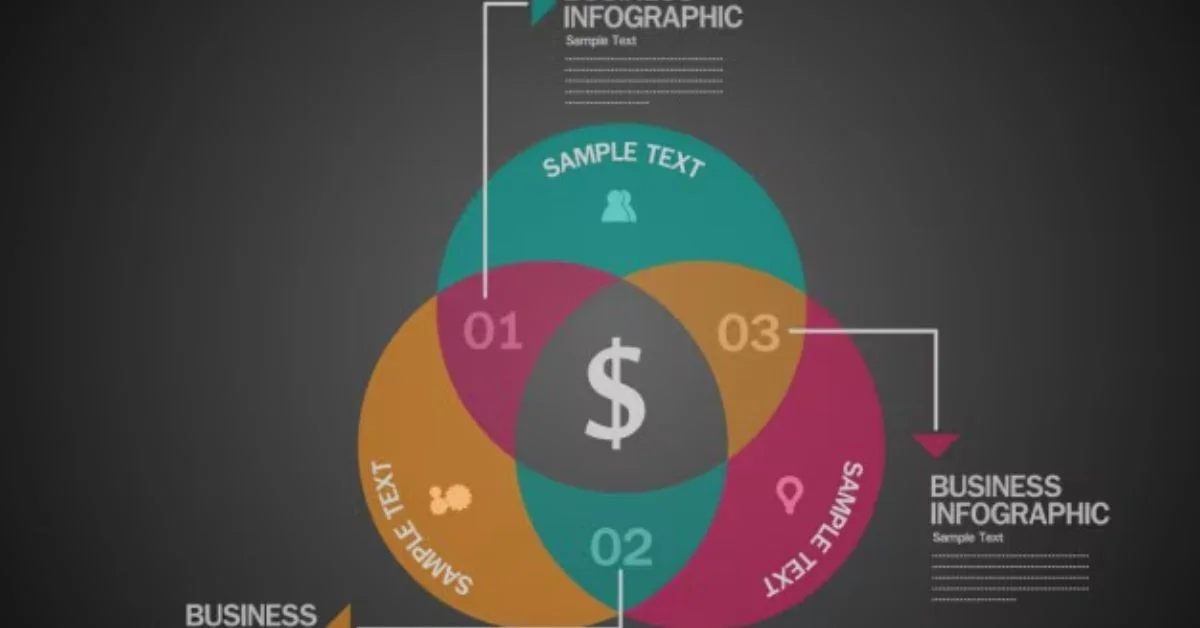
Anatomy of the Customer Success Venn Diagram
The classic Venn diagram consists of three overlapping circles. In the context of customer success, the key categories often include:
1. Customer Goals
What outcomes are the customers trying to achieve? This includes:
- Efficiency gains
- Cost reduction
- Growth in their own customer base
- Compliance or risk mitigation
Understanding goals requires empathy, listening, and strong onboarding processes.
2. Product Capabilities
What does the product actually do—and how well? This includes:
- Feature adoption rates
- Usability metrics
- Integration depth
- Scalability
It’s not about what’s in the product roadmap. It’s about what the customer is actually using and benefiting from today.
3. Company Outcomes
What does the business need to achieve?
- Churn reduction
- Net revenue retention (NRR)
- Upsells and expansions
- Positive customer references
All three circles must align. Where they overlap is the sweet spot of sustainable value—the essence of true customer success.
Visualizing Alignment and Gaps
The power of the Venn diagram is diagnostic. By mapping your operations across the three domains, you can:
- Identify misaligned efforts (e.g., features that don’t support customer goals)
- Spot opportunities for deeper engagement (e.g., underused product capabilities)
- Understand which success initiatives drive both customer and company outcomes
This clarity drives smarter investments and stronger cross-team accountability.
Practical Applications of the Framework
1. Onboarding Strategy
Use the diagram to map how onboarding activities help bridge product capability with customer goals.
- Are we teaching what matters?
- Are success metrics defined early?
- Is value realization happening fast enough?
The overlap of onboarding goals and real product usage helps reduce time to value.
2. Health Score Calibration
Customer health scores should reflect not just engagement or ticket volume, but the center of the diagram:
- Is the customer using key features tied to their goals?
- Are they delivering outcomes that support our business model?
This makes health scores predictive, not just reactive.
3. Customer Journey Mapping
Align touchpoints to the Venn overlap:
- QBRs (Quarterly Business Reviews) should track progress toward shared outcomes
- Support should escalate based on strategic value, not just issue severity
- Product training should focus on areas of mutual benefit
A journey aligned with the Venn model is one built for growth.
Case Study: Venn Thinking in a SaaS Context
Consider a B2B SaaS platform that serves mid-market HR departments. Using the Venn framework:
- Customer Goal: Automate payroll and improve employee onboarding
- Product Capability: Offers powerful automation but poor mobile accessibility
- Company Outcome: Drive upsell through module adoption
The diagram reveals a gap: while product can support automation, mobile usability hinders adoption. Mobile optimization becomes a strategic initiative for both retention and upsell. Customer success plays a central role in surfacing this insight.
Cross-Functional Alignment Through the Venn Lens
Success isn’t achieved in a vacuum. Each department owns a slice of the diagram:
- Product Teams: Ensure capability expands toward customer needs
- Sales Teams: Align selling points with core customer goals
- Marketing: Communicate value in terms that reflect real outcomes
- Support: Tailor triage and response around strategic accounts
The Venn diagram becomes a common language—an artifact that breaks silos.
Metrics That Emerge from the Intersection
Rather than report separately on usage, sentiment, and revenue, the Venn model encourages blended KPIs:
- Goal Achievement Rate: % of customers achieving declared outcomes
- Adoption-Outcome Ratio: How often product usage aligns with intended value
- Mutual Value Index: A proprietary score based on combined success
These metrics move the organization from operational tracking to strategic performance.
Designing Around the Diagram
Product features, support policies, pricing models—everything can be designed with the diagram in mind. For example:
- Feature requests from the overlap zone get prioritized
- Support tiers reflect customer value, not just spend
- Pricing structures reward mutual outcomes, like API integrations or usage milestones
This design philosophy creates a business that grows alongside its customers, not just on top of them.
Evolving the Diagram: When Four Circles Make Sense
Some organizations add a fourth circle for “Market Forces” or “Partner Capabilities.” This recognizes that:
- Ecosystem integrations can unlock dormant value
- Industry trends shape what success looks like
While the triad remains foundational, the model is flexible enough to expand.
Risks and Misapplications
- Over-simplification: Real customers are complex; don’t reduce them to a single goal.
- Stagnation: The overlap zone should evolve with each product iteration.
- Tokenism: Don’t use the diagram as a presentation prop—embed it into planning.
The diagram is only as good as the actions it inspires.
Embedding Venn Thinking in Culture
Success-driven organizations:
- Make the diagram part of onboarding for all roles
- Use it as a template in quarterly planning
- Display it in war rooms and CRM dashboards
It’s not just a model. It’s a mindset.
Final Thoughts
The customer success Venn diagram is a deceptively simple but strategically profound tool. It forces clarity around what really matters: aligning your product’s capabilities with customer ambitions and company health. At its best, it’s not just a way to map success—it’s a way to build it.
In a world obsessed with data, dashboards, and OKRs, this visual framework brings human-centered logic back to business strategy. It reminds teams that behind every renewal, there’s a relationship. Behind every feature, a user story. And behind every success, an intersection of aligned goals.
The future of business isn’t just customer-centric—it’s intersectional. And the Venn diagram might just be the most powerful shape in your toolkit.
For more information, click here.